 |
| Expense Growth - Past, Present and Future source: Owen Sound Audit Financial Statements |
Excessive Growth in City Budgets
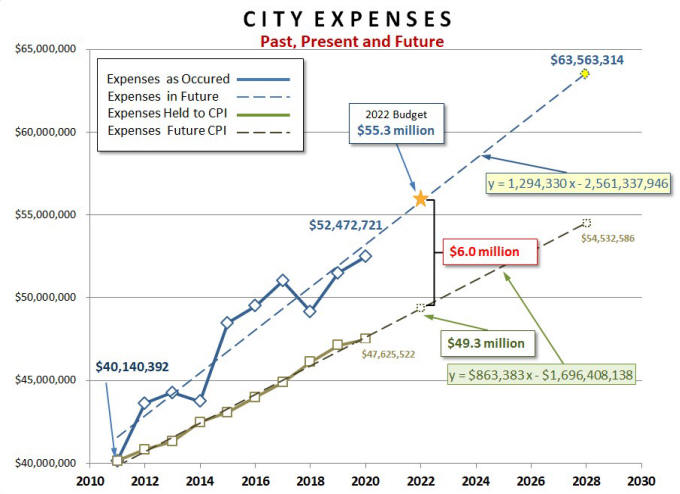
City expenses increased by $12.3 million or 30.7% between 2011 and 2020. This was well beyond the 18.3% increase in the Consumer Price Index (CPI) for the same period. As shown in this graph below, the increase in expenses followed a relatively linear path during the study period. The linear projection of expenses, shown as dashed lines, into the future shows that expenses have been increasing steadily at a rate of nearly $1.29 million per year. If Council continues on this path, expenses are projected to reach $63.5 million in the next 6 years. This represents an increase of $23.5 million from the $40.1 million they were in 2011
To verify the
accuracy of our projection we can use the equation for Trend Line, shown on the
chart, to calculate a point on the Trend Line for 2022. The projected result for
2022 is $55,797,314.
|
|
| Expense Growth - Past, Present and Future source: Owen Sound Audit Financial Statements |
The budget approved by Council for 2022 has expenses of $55.3 million which is shown on the above chart with a gold star. Although this is slightly lower than that estimated by the Trend Line, it does give us a high level of confidence in the accuracy of the Trend Line established from the 2011 to 2020 data.
 |
| Departmental Expense Growth source: Owen Sound Audit Financial Statements |
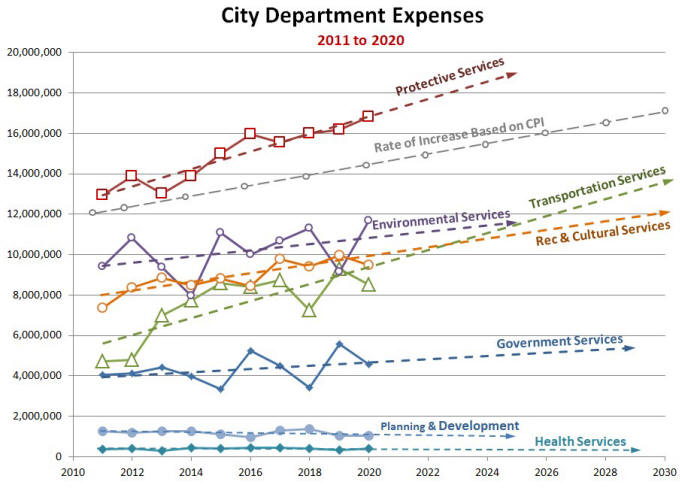
As shown in the graph above, the vast majority of the expense increases are the
result of the large annual increases that have occurred in two areas, Protective
Services and Transportation. The cost of Protective Services has historically
been increasing at an average rate of $433 thousand per year and the cost of
Transportation has been increasing at $421 thousand per year. These two cost
centers alone account for 66% of the total expense increase rate of $1,294,334
per year.
The gray dashed line shown on the graph is an indication of how inflation
changed during the study period. Trend lines are shown by the dashed lines for
each of department. Departments with a slope greater than the gray line are
growing at a rate faster than inflation. Departments with a slope that is less
than the gray line, such as Government Services are growing at a rate that is
less than inflation. We see that in addition to Government Services, Planning
and Development and Health Services showed only moderate growth during the study
period.
 |
| Growth of City Expenses Relative to Population Growth Sources: Statistics Canada, and Financials |
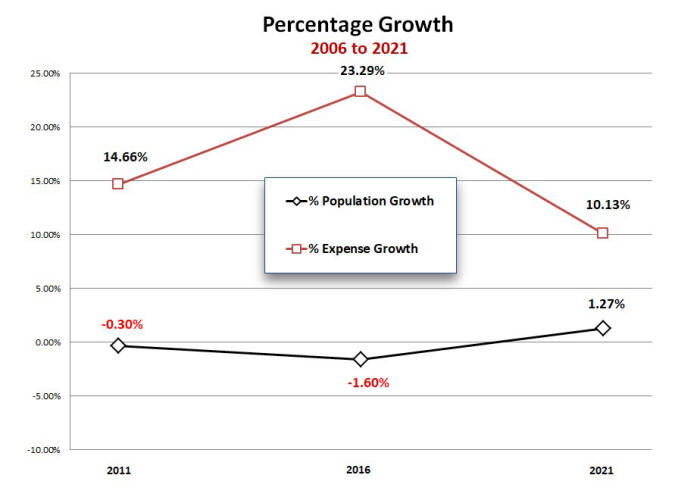
The census is taken every five years. From 2006 to 2011 our population
contracted by 0.30%. During the same period city expenses grew from $35.0
million to $40.1 million or an alarming 14.66%. Also, between 2011 and
2016 the population again contracted by 1.60%. At the same time city expenses
grew from $40.1 million to $49.5 or by a whopping 23.29% on top of the previous
increase.
The net result over this ten year period between 2006 and 2011 was that expenses grew by $14.5 million from $35.0 million to $49.5 million or 41.4%. How can it cost 41.4% more to run the city during this ten year period when the population contracted by 1.89 percent? In total, the cost to run the city grew by $19.5 million from $35.0 million in 2006 to $54.5 million in 2021. At the same time Owen Sound's population was reduced by 141 residents from 21,753 in 2006 to 21,612 in 2021.
It is unreasonable to expect expenses to have been frozen at the 2006 level just because our population didn't grow. As we all know, the cost of products and services go up a little every year. It would have been reasonable for city expenses to grow at the same rate as inflation. Had the annual increases in expenses been capped at inflation, the total expenses in 2021 would have been $48.5 million instead of the $54.5 million that actually occurred. That puts the excessive growth in expenses to be in the order of $6.0 million for the period 2006 to 2021. Approximately, 76% of this would have affected the total tax levy which also includes a portion going to the County. That’s a difference of about $4.5 million in the tax levy. A generous approximation is that $350,000 represents a one percent increase in the tax levy. So had the city held the annual increase in expenses to inflation over the past 11 years, the tax levy would be approximately 13% or $4.2 million less than the $32.5 million that it is today.
 My previous articles on taxation during the period 2011 to 2020, were based on
the city’s Audited Financial Statements available on the city’s website. The
Audited Financial Statements give us a high level of confidence. However, as
currently constructed they do not provide sufficient visibility for us to see
how individual department budgets are growing. For example, the audited
financials show us statements for “Recreation and Cultural Services”
which includes the Library, the Art Gallery, the Bayshore and the Rec Centre.
However, the city’s audited financial statements are currently structured to
show only groups of departments, so the Rec Centre for example is lumped in with
the Library, the Art Centre and the Bayshore under the heading of “Recreation
and Cultural Services”. Therefore we have no idea how any of these
individual departments performed during the study period. Perhaps the city will
change this to give taxpayers more visibility in the future.
My previous articles on taxation during the period 2011 to 2020, were based on
the city’s Audited Financial Statements available on the city’s website. The
Audited Financial Statements give us a high level of confidence. However, as
currently constructed they do not provide sufficient visibility for us to see
how individual department budgets are growing. For example, the audited
financials show us statements for “Recreation and Cultural Services”
which includes the Library, the Art Gallery, the Bayshore and the Rec Centre.
However, the city’s audited financial statements are currently structured to
show only groups of departments, so the Rec Centre for example is lumped in with
the Library, the Art Centre and the Bayshore under the heading of “Recreation
and Cultural Services”. Therefore we have no idea how any of these
individual departments performed during the study period. Perhaps the city will
change this to give taxpayers more visibility in the future.
The city does have some information on their website for some departments. I was
able to use these to gain some insight into a few departments and it appears
that the rapid growth in budgets is extreme for some departments. For example, I
was able to compile sufficient data on the Art Gallery, to construct the graph
below. I also found a couple examples of extreme growth in the 2022 budget that
I will discuss later.
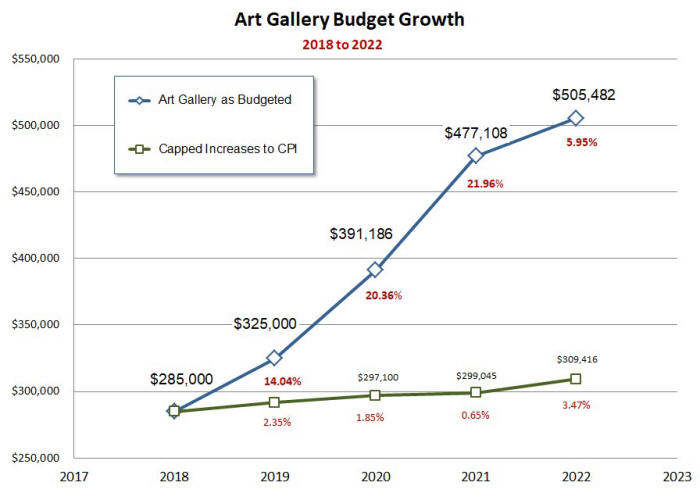 |
| Tom Thomson Art Gallery Expense Growth 2018 to 2022 source: Owen Sound Audit Financial Statements |
The graph above shows the operational budget for Art Centre for a five year
period from 2018 to 2022. We can see in this graph that the Art Gallery’s burden
to taxpayers, during this five year period, actually grew by $220,482 or 77.3 %.
This rapid growth becomes very obvious when plotted alongside the budget that
would have occurred had expenses been capped at the rate of increase for CPI,
shown in the above graph as a green line. This is highly irregular for a public
institution, especially since two of these years occurred during COVID lockdowns
during which time the Gallery was closed to the public. We also see that the Art
Gallery’s burden to taxpayers experienced double digit growth during this
period. Surprisingly in two of these years, 2020 and 2021 the growth exceeded
20% per year.
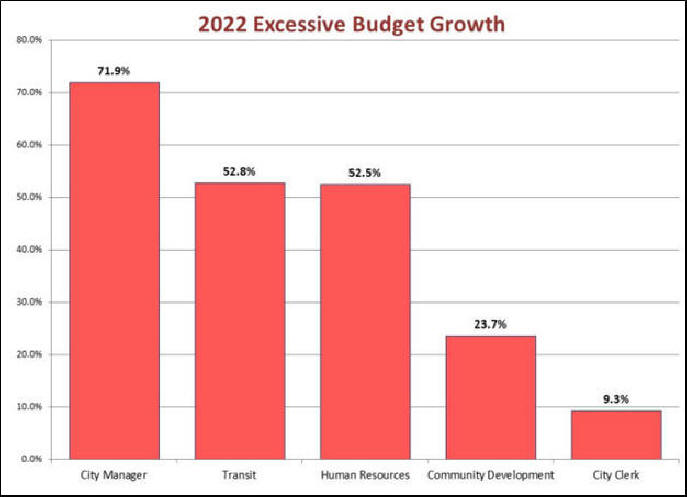 |
| Percentage Growth of Selected 2022 Department Budgets source: Owen Sound Audit Financial Statements |
After reviewing the excessive growth that occurred in the Art Gallery I
thought I should take a quick look at the growth of other departments as
reported in the 2022 Budget. In the 2022 budget, there were 5 areas that had
extreme budget growth in excess of 9%. The City Manager’s Office experienced the
greatest growth on a percentage basis of 71.9%. This was followed closely by
Transit which grew by 52.8%. Human Resources grew by 52.5%. Community
Development grew by 23.7% and the Clerk’s office grew by 9.3%. As for the 71.9%
increase in the City Manager’s Office – it seems excessive and given the times
we are in Council should not have been approved this increase
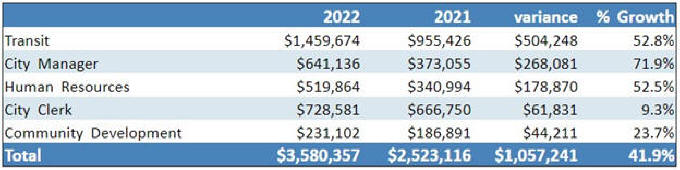
Above numbers are from the Final-Reduced Budget posted on the city’s
website
source:
2022 Budget:
https://www.owensound.ca/en/city-hall/resources/Documents/Consolidated-Budget-Book---Final-Reduced.pdf
In spite of the 2022 department budget statements at the above link being labeled "Final-Reduced", these numbers differ from those in the 2022 Tally Sheets shown in this document. The Tally Sheets show: Transit growth at $515,518 or 54.0%; City Manager budget growth at $158,081 or 42.4%; HR at 119,772 or 35.1%; City Clerk budget growth at $70,756 or 10.6%; and Community Development at $16,386 or 8.8%. I’m guessing that these are actually the reduced numbers and that staff forgot to change the individual department budgets to reflect the reduction. Regardless of which numbers are correct, the department statements or the Tally Sheets, these are absolutely huge increases for a single budget year and should not have been approved by Council